CBA Website Archive (Until 2023)
Contact Webmaster
Graphic Generator
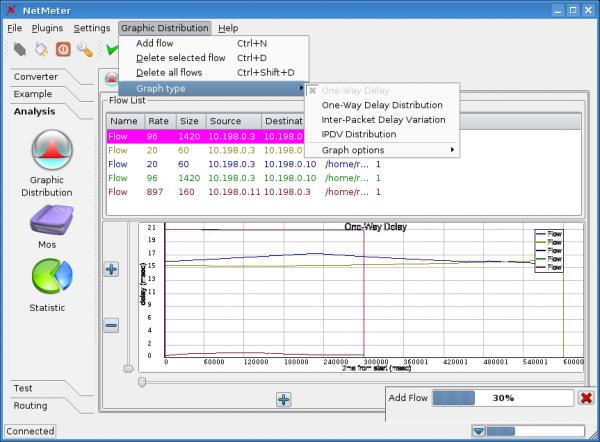
The graphic generator is able to open and plot all the basic graphic representation of the most common statistics required on network measurements. Graphics include:
-
One Way Delay
-
One Way Delay Distribution
-
IPDV
-
IPDV Distribution
With different filling options, multiple graphics and multiple layer representation. It is also possible to generate a PNG or a JPEG of the output by clicking on the graph with the right mouse button.
By using OpenGL this plugin enables NetMeter to perform real-time zooming and panning of the representation.


