CBA Website Archive (Until 2023)
Contact Webmaster
SMARTxAC
General project information
SMARTxAC is a project carried out under a collaboration agreement between the Advanced Broadband Communications Center (CCABA) of the Technical University of Catalonia (UPC) and the Supercomputing Center of Catalonia (CESCA).
SMARTxAC aims to develop and deploy a passive measurement infrastructure and a real-time analysis system for high-speed links. Currently, SMARTxAC is being used for capturing and analyzing the traffic of the Anella Científica (Scientific Ring). The Anella Científica is the name of the Catalan R&D Network, which is managed by CESCA and connects about 50 Universities and Research Centers in Catalonia.
The tapped link is built from a pair of GigE links (one for each traffic direction) that connect the Anella Científica to RedIRIS (Spanish R&D network) and to the global Internet. Current traffic volume on this link is about 600 Mbps and it is increasing day after day, so that data collection is facilitated by an Endace DAG 4.3GE measurement card. Full-traffic analysis at full-line rate is performed in real-time using the SMARTxAC analysis software developed at the Advanced Broadband Communications Center (CCABA) of the UPC.
A three hours GPS-synchronized and anonymized IP header trace was captured for the NLANR/PMA project in February 2004 using the capture point and collection platform in the Anella Científica. This data set was published and can be downloaded at CESCA-I section of NLANR/PMA website.
SMART
A new evolution of SMARTxAC, which will be named SMART, is currently under development at CCABA-UPC. SMART is specifically designed to perform at gigabit speeds and will integrate both the capture engine as well as the real-time flow traffic measurement and analysis in the same software. This new platform will be able to perform in real-time at gigabit speeds without packet looses, using only one machine for collection and analysis (measurement box), equipped with one or more Endace measurement cards. Up to now, SMART collection and analysis platform has been tested with up to 2 Gbps of real traffic without experiencing packet looses. Unfortunately, it is not possible to operate at full-line rate in OC192/10GigE links using standard PC equipment if no additional hardware is used for traffic processing and analysis. Although, most of high-performance backbone networks are overprovisioned and designed to use less than its total link capacity, using even load balancing techniques, so that in this case, SMART would be able to perform in real-time in OC192/10GigE networks without using specialized hardware for traffic analysis.
A first version of SMART was tested in one of NLANR/PMA OC192MON's located on SDSC's TeraGrid Cluster. The data collection was facilitated by a pair of Endace DAG6.1 OC192 measurement cards operating in 10Gigabit-LAN mode. These experiments were carried out by %This email address is being protected from spambots. You need JavaScript enabled to view it. ">Pere Barlet (technical coordinator of SMARTxAC and main developer of SMART) during a two months research stay in New Zealand (at Endace Measurement Systems, Ltd.) in joint project between CCABA-UPC and the PMA project (Passive Measurement and Analysis) of the NLANR (National Laboratory for Applied Network Research).
Some results of SMART running on one of NLANR/PMA OC192MON's located on SDSC's TeraGrid Cluster can be found in the section Teragrid-II 10GigE real time analysis of NLANR's website.
Summary of SMART v0.1 features:
- Real-time traffic capture and visualization tool
- Generation of html reports (including high-resolution timeseries plots) in real-time. HTML pages are updated every 20 sec. (configurable)
- Support for DAG cards and libpcap
- Collection from multiple interfaces at the same time
- Multithreaded. There is a capture thread for each interface. Capture and analysis tasks are also done by different threads. So that it can make good use of multiprocessor machines
- Programmable. All databases can be configured according to the monitored network, including networks, application/port and protocol databases
- Performance can be adjusted via multiple options. So that the tool can be easily configured to generate less detailed results if more performance is needed
- An independent HTML page is generated for all selected destinations, plus a total summary page
- Each page contains the following graphs in bits/s, pkts/s and tuples/s, for the last hour/day/week/month/year, and for incoming and outgoing traffic:
- Application breakdown timeseries plot
- Protocol breakdown timeseries plot
- Destination breakdown timeseries plot
- Each page also contains the following tables:
- Traffic by application
- Traffic by protocol
- The following features were deactivated during testing stage at NLANR, due to NLANR's anonymization restrictions:
- Longest-prefix match algorithm (using a Patricia Trie implementation) in order to classify the traffic according to its origin and destination networks or AS
- Traffic by AS and network timeseries plot
- AS and network matrices
- All previously mentioned graphs not only for total link traffic but also for each AS, organization/institution or network connected to the monitored network
Also, SMART will include all traffic analysis features of SMARTxAC soon (see SMARTxAC features below).
The following graphs were generated by SMART running on one of the two OC192MON's at SDSC on March 2004 (positive and negative values indicate incoming and outgoing traffic respectively):
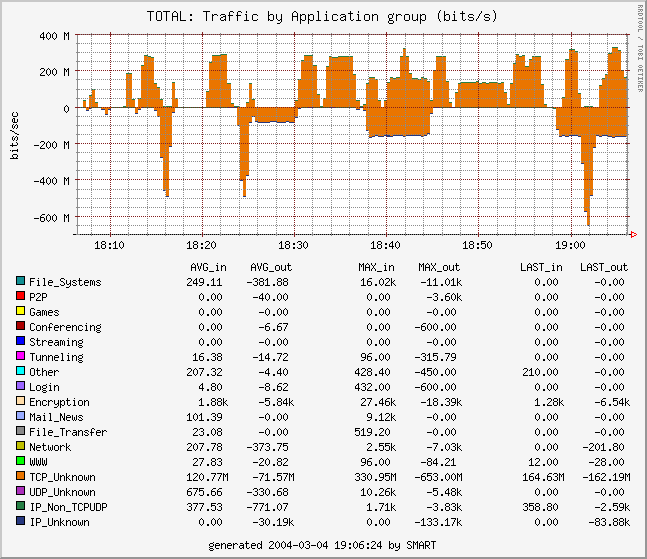
Application timeseries (1 hour, 20 sec. average, bits/sec)
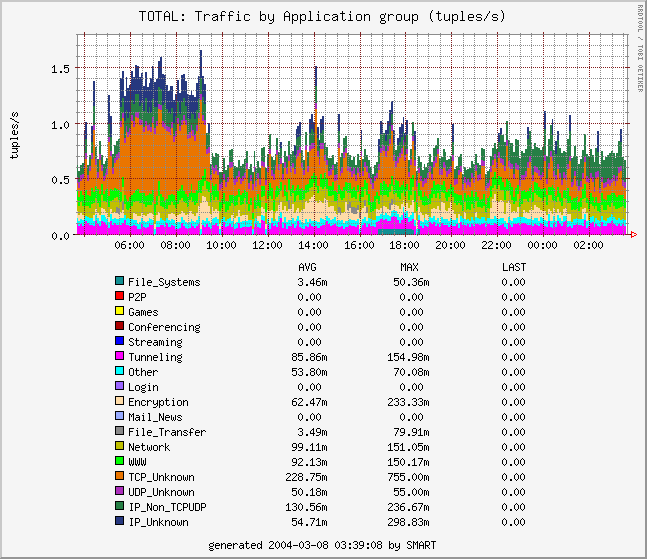
Application timeseries (daily, 5 min. average, tuples/sec)
SMARTxAC
During last years the CCABA-UPC has been involved in several projects related to traffic measurement in Research and Academic Networks, such as CASTBA, MEHARI and MIRA. As a result of such experience, a traffic-monitoring platform, called SMARTxAC, was wholly developed at CCABA-UPC for permanent monitoring of the Catalan R&D network (Anella Científica). SMARTxAC is a passive traffic measurement system with full-traffic capture and real-time analysis capabilities, provided with a web based graphical interface able to present the traffic analysis results online. The following figure shows the three components of the SMARTxAC platform: the capture system, the traffic analysis system and the result visualization system (the new SMART real-time capture and analysis system will use only one machine for collection, analysis and visualization):
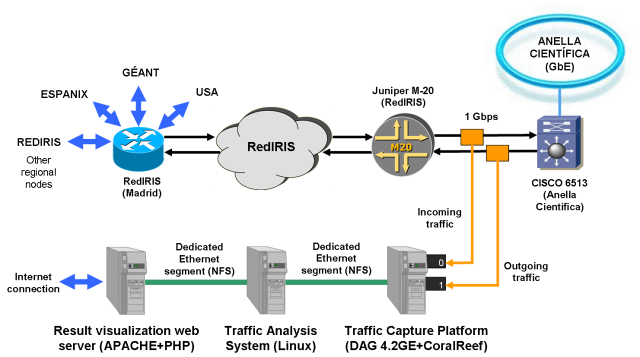
SMARTxAC platform overview
Traffic capture system is based on passive traffic measurement of a Gigabit Ethernet link, using optical splitters. A whole copy of the traffic is collected by a PC equipped with a DAG 4.3GE card and CoralReef suite (CoralReef is going to be replaced shortly by SMART, which is currently under testing stage). In order to analyze all the traffic in real-time, only packet headers are captured and aggregated into flows by CoralReef, which reduces the data volume to be processed by the traffic analysis system.
Traffic analysis system aggregates captured flows into a new kind of flows called classified flows. Aggregation is performed by translating the values identifying a flow (source/destination IP addresses, transport protocol and ports) into more general values (origins, destinations and applications respectively). Origins are considered as the institutions of the monitored network and destinations are the external networks which Anella Científica is connected to (see previous Figure).This process is very simple and can be easily done in real-time without loosing valuable data about network usage. It also allows reduction of data volume and permanent storage, since flow identification key is reduced. Moreover, the traffic that cannot be classified, because its address does not correspond to any institution or its ports are unknown, is classified more detailed in order to detect anomalies. The analysis results for each institution can be viewed online using the result visualization system. This system is based on a dynamical web interface, developed in PHP. The graphs are generated on-demand by external graphic generation tools, such as RRDTool.
With SMARTxAC visualization system is possible to access in real-time via web (graphs are updated every 5 min) to the following graphs for each institution and access point to the Anella Científica, classified in daily, weekly and monthly periods (in bits/sec and packets/sec units):
- Application timeseries plot
- Institution/access point breakdown
- Destination network breakdown
- Application breakdown
- Protocol breakdown
- Destination per applications breakdown
- Destination per institution/access point breakdown
- Unknown ports log
- Unknown IP addresses log
- Unknown protocols log
- Top-N ports and applications
- Top-N IP addresses
- Top-N protocols
SMARTxAC measurement platform is also being used to obtain:
- Packet size distribution
- Packet inter-arrival distribution
- Self-similarity estimation (Hurst parameter)
Currently, SMARTxAC is reporting detailed information about the Anella Científica usage, which is useful for the network managers to detect irregular (non-academic) usage or network attacks once they occur. Ongoing work is focused on develop an automatic anomaly detection module for SMARTxAC. Such a new module will be based on checking the traffic patterns of the institutions connected to the network and on detecting unexpected changes, which will be assumed to be produced by anomalies in network usage. Once a traffic profile change (anomaly) will be detected, the system will send an alarm to the network manager and will store some additional data concerning the anomaly. Off-line analysis of stored data will be used in order to detect anomaly causes.
The following graphs were generated by SMARTxAC running on the Anella Científica's GigE monitor on April 2004 (positive and negative values indicate incoming and outgoing traffic respectively):
Note: Graphs concerning institutions, access points, networks, etc. are not included here in order to preserve institution confidientally.
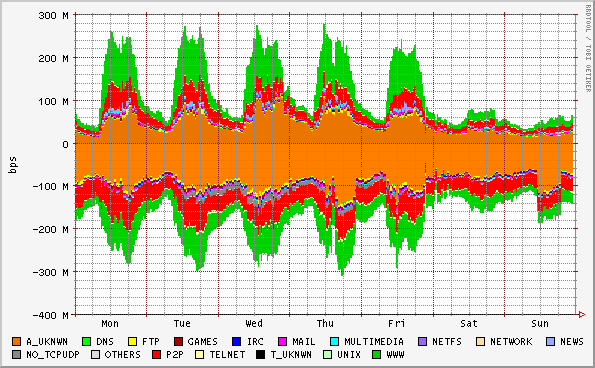
Application timeseries (weekly, bits/sec)
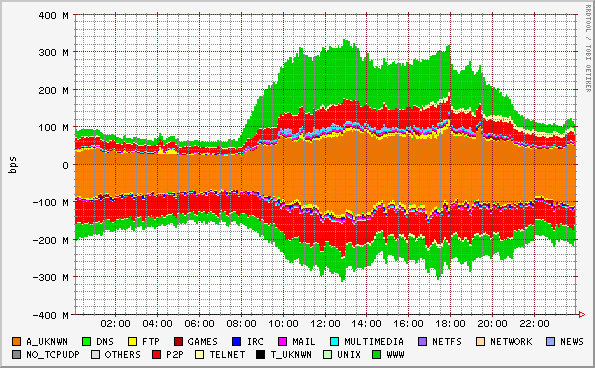
Application timeseries (daily, bits/sec)
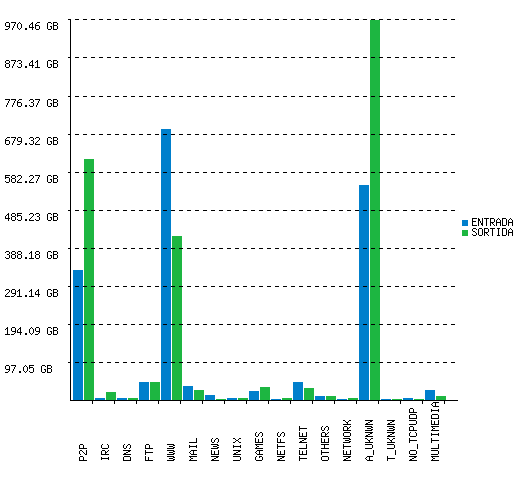
Application breakdown (daily, bytes)
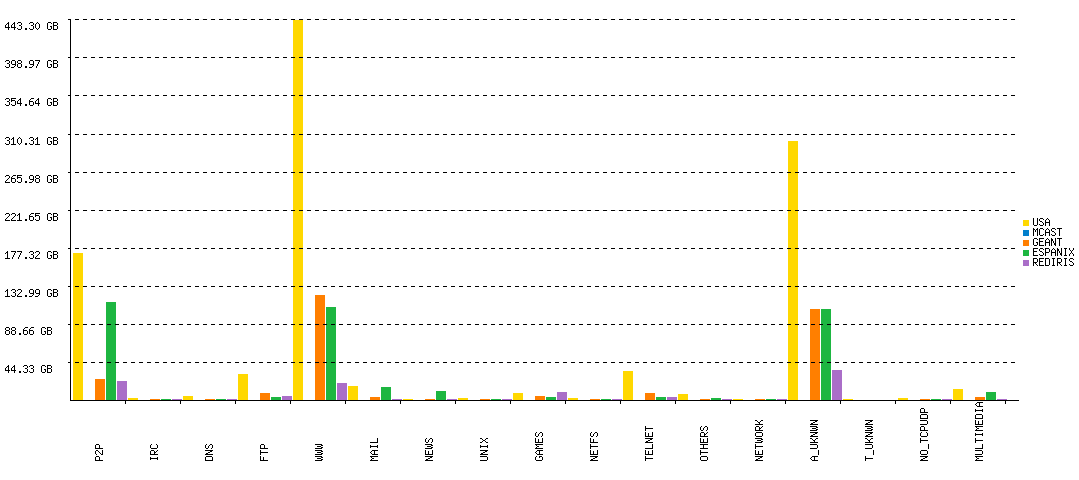
Destination per Application breakdown (daily, incoming bytes)
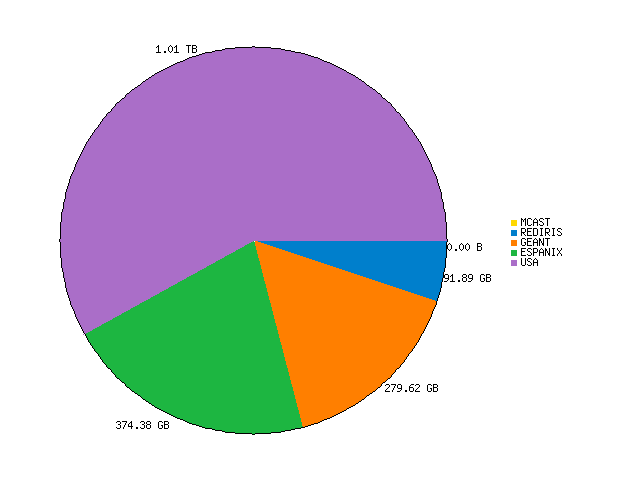
Destination breakdown (daily, incoming bytes)
It is worth noting that traffic is classified according to the packet headers (source and destination addresses, protocol and ports). Packet payloads are not captured in order to preserve user confidentiality. Thus, traffic classified as "unknown" is that from applications using unknown ports (ports that do not correspond to any known application). As a consequence, for "unknown" traffic is not possible to establish which application generated that traffic. In most cases, this traffic is generated by P2P applications, FTP transfers in passive mode, tunneling, etc.
Typically, tricky users run P2P applications using unknown ports or ports corresponding to another applications in order to cover up their actions and to cross firewalls. In the same way, traffic classified as known could be generated by a P2P application using ports belonging to another well-known application. On the other hand, often, the identification of specific applications is difficult as tunneling (e.g. HTTP tunneling) is commonly used in the presence of firewalls and usage restrictions. This might also have impact on the performance of classifiers trying to separate different applications/application types.


